
May the Italian gods forgive me, I am not good at DAX. I am not saying that I do not appreciate the power of this language, but I have not had enough opportunity to practice it to evolve at ease.
So naturally, when I heard about visual calculations and the promise of relieving users like me in the development of measures, I could only long for this new feature.
As the famous mantra repeated by Alberto Ferrari says:
DAX is simple, but it’s not easy.
Even though DAX uses a simple and functional language similar to Excel, some concepts such as context make this language powerful but complicated to grasp for novices or people who do not have the pleasure of being able to practice it enough like me.
That being said, dive with me into the story of Olaf, our finance guardian who struggles to get the desired results with DAX. Thanks to visual calculations, he will finally be able to excel in creating his measures.
Be warned, brave explorer, that Visual Calculation is currently in preview. Tread carefully on this new terrain.
The need for versatility
Olaf is very satisfied with his financial reports on Power BI, but sometimes needs new measures to help him make better decisions. Although Olaf is proficient in Excel formulas, he struggles with DAX. He remains stuck in a zone of discomfort and usually ends up asking for help from his colleagues, looking for bits of answers on forums that he adapts as best he can, or sometimes even giving up on some ideas that seemed too complicated to implement for the added value they would bring.
In an ideal world, Olaf would drop everything to immerse himself in intensive courses, honing his DAX skills and dreaming in Italian about context transitions. In reality, Olaf only has a few moments to spare, as he juggles multiple priorities.
Faced with this situation, the need for a flexible and versatile tool becomes apparent. Just as a Viking longship must navigate both the high seas and the fjords, a tool like Power BI must adapt to the needs of both experienced and occasional navigators. It is a compromise, and it is the best solution to accommodate everyone’s needs and abilities.

How does it work?
Visual calculations are measures that are defined and executed directly on a visual, rather than at the level of the complete semantic model. This allows us to reference aggregated data from a visual for our new calculation while removing the complexity of having to take into account the filter context.

For example, let’s take as a base the visual below that displays the sales that the clan has made each month of the current year.

By selecting the visual and clicking on New calculation, it will open the visual calculation edit mode which consists of 3 different parts:
- The preview of the visual that shows us the rendering we are working on
- A formula bar that enables us to insert our calculation
- A table that allows us to validate the result of our visual calculation.

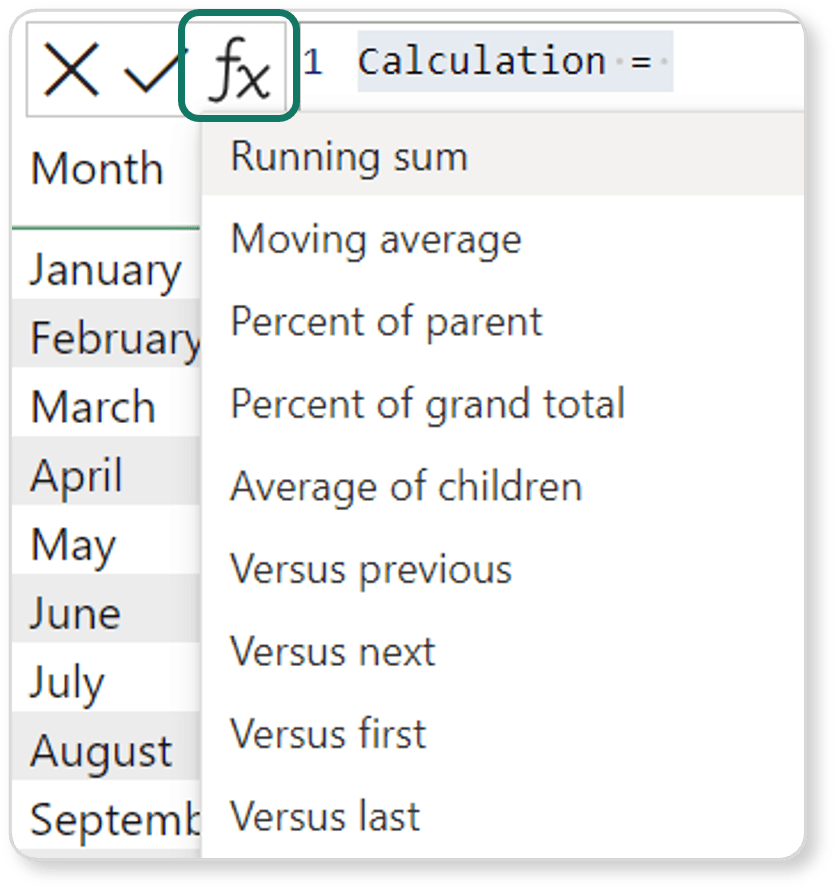
By selecting the fx button, we get a list of useful functions for our visual calculation. For this example, we will, for instance, select Running Sum to perform a running total of our sales.
We replace ‘field’ with a column name, and optionally rename the visual calculation, and we obtain a code similar to the one below.
Running total = RUNNINGSUM([Sales])
The new visual calculation will then be added to our list of fields, and the preview will show us the result of this new visual.
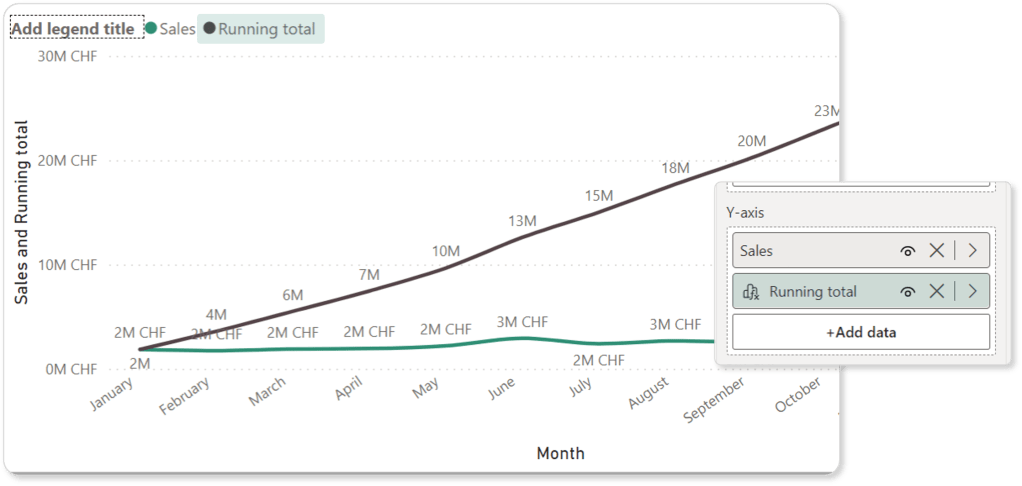
All fields used in our visual calculation must be present in our visual. However, it is possible to hide these source values by selecting the eye icon, so they do not appear in the final version of the visual.
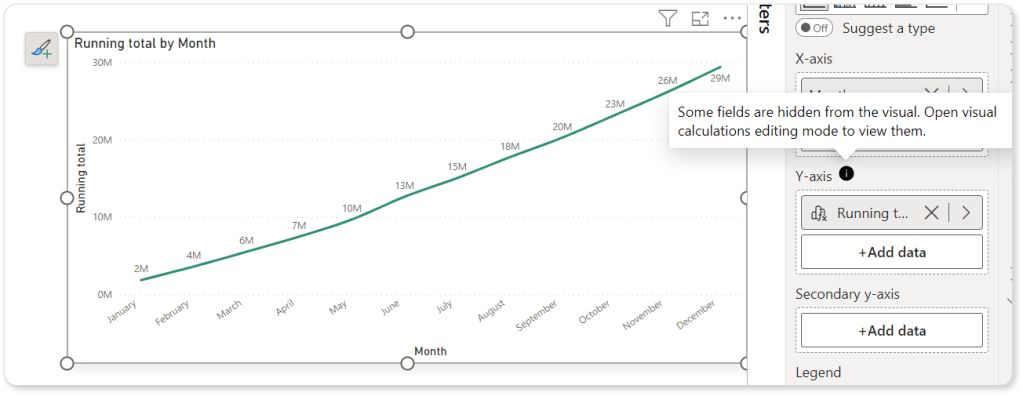
It is best practice to avoid leaving hidden fields that are not used in visual calculations. Removing irrelevant information declutters the visual, improving readability and performance.
Taking another example, the code below allows you to return last month’s sales in DAX:
CALCULATE(
    [Sales Amount],
    PARALLELPERIOD(
        DimDate[Date],
        -1,
        MONTH)
)
Here is its equivalent with a visual calculation if you list sales by month:
PREVIOUS([Sales])
There is no comparison, the code is as simple as raiding a coastal village with a crew. and will make life easier for many Power BI developers!

When should it be used ?
Or rather, when should visual calculations not be used?
Although it is true that they are an unequivocal feature that facilitates the creation of calculations, I believe that they should be used judiciously and only in situations where they are truly beneficial.
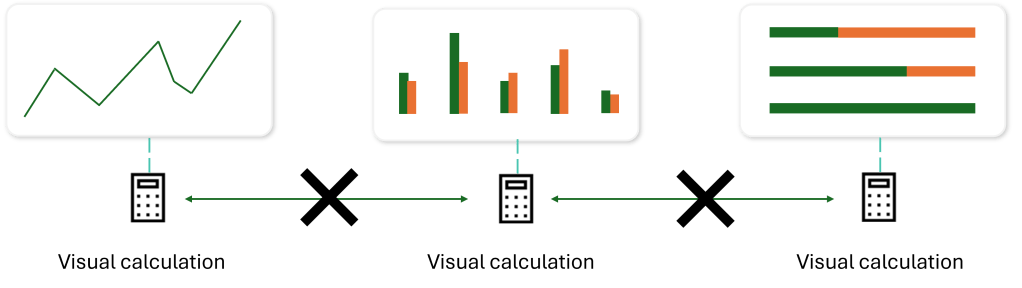
It is important to remember that visual calculations are, as their name suggests, attached to a visual only. If we need the same calculation in another visual or even in another report that consumes the same semantic model, duplicating the logic in each visual can complicate maintenance and increase the risk of error.
To refer to another mantra, I can refer to that of Matthew Roche, which says:
Data should be transformed as far upstream as possible, and as far downstream as necessary.
Even if I cannot really talk about transformation here, the principle remains the same. By creating a measure at the source of the model, it allows the implementation of the principle of code reusability, facilitating maintenance and allowing the same code to be reused on several visuals, or even on several reports.
I am not saying that visual calculations should never be used. They clearly have their place in Power BI and reduce the learning curve. As much as they represent an opportunity for users to gain autonomy, it is important to remember that they also present a risk to the quality of the data.
To answer the question of when it is wise to use them, I would say that visual calculations are an excellent alternative to DAX measures when:
- Our level of DAX is not sufficient to obtain the expected result
- It is difficult to quickly improve our skills to fill this gap
- The need is isolated and should not require reusability
If all these criteria are met, then I think we can freely enjoy the benefits of this great feature!
Conclusion
I think this feature has been long awaited and for good reason, it finally facilitates access to the creation of one’s own calculations, even if one does not master the DAX language.
A suitable mantra for visual calculations could be an adaptation of the previous one, resulting in something like this:
Visual calculations should be used as little as possible, and as much as necessary.
While Visual calculations offer users more autonomy, it’s important to remember they can also affect data quality.

It is certain that Olaf will use this feature daily as it makes access to Power BI even easier for him, but it is important for him to also understand the associated risk. Olaf will continue to progress on this tool, and he should also try from time to time to create his own DAX measures.

Leave a comment